
Project Portfolio with agileCCPM in Jira
1. Quickly Understand Project Health
The agileCCPM Dashboard provides you with powerful ways to quickly assess the health of your projects at a glance. Whether you are managing a portfolio of multiple projects or focusing on a single initiative, our tools make it easy to stay on top of progress.
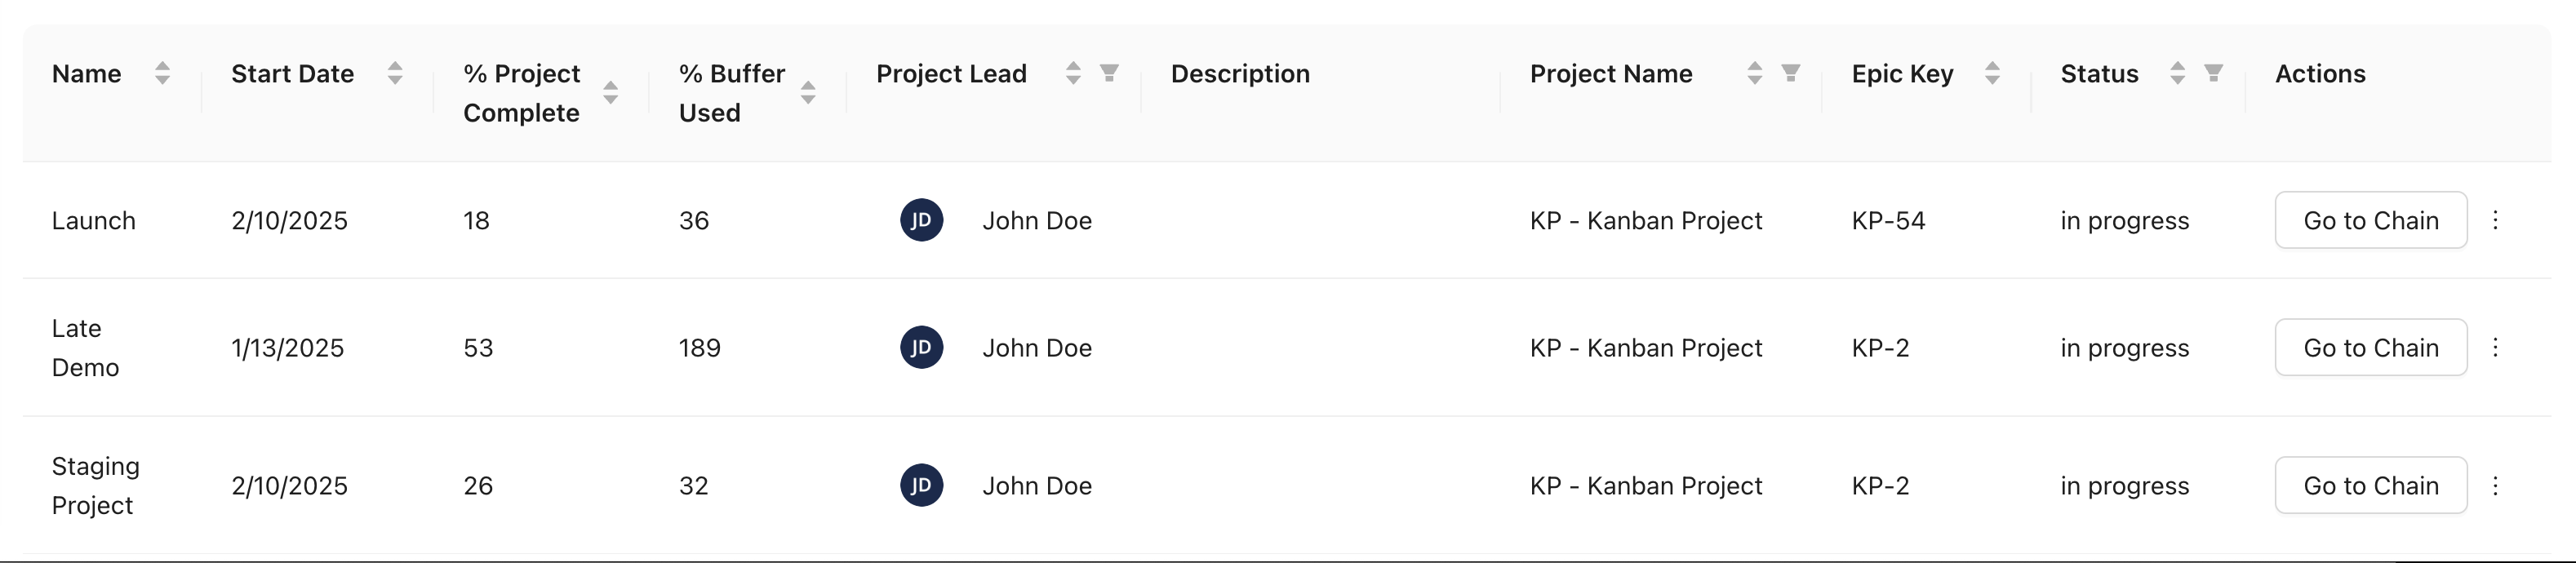
One of the easy to use views is the Table View, which presents the most critical information about your projects in a clear and concise format:
Fever Chart: A Visual Summary of Citical Chain Projects Health
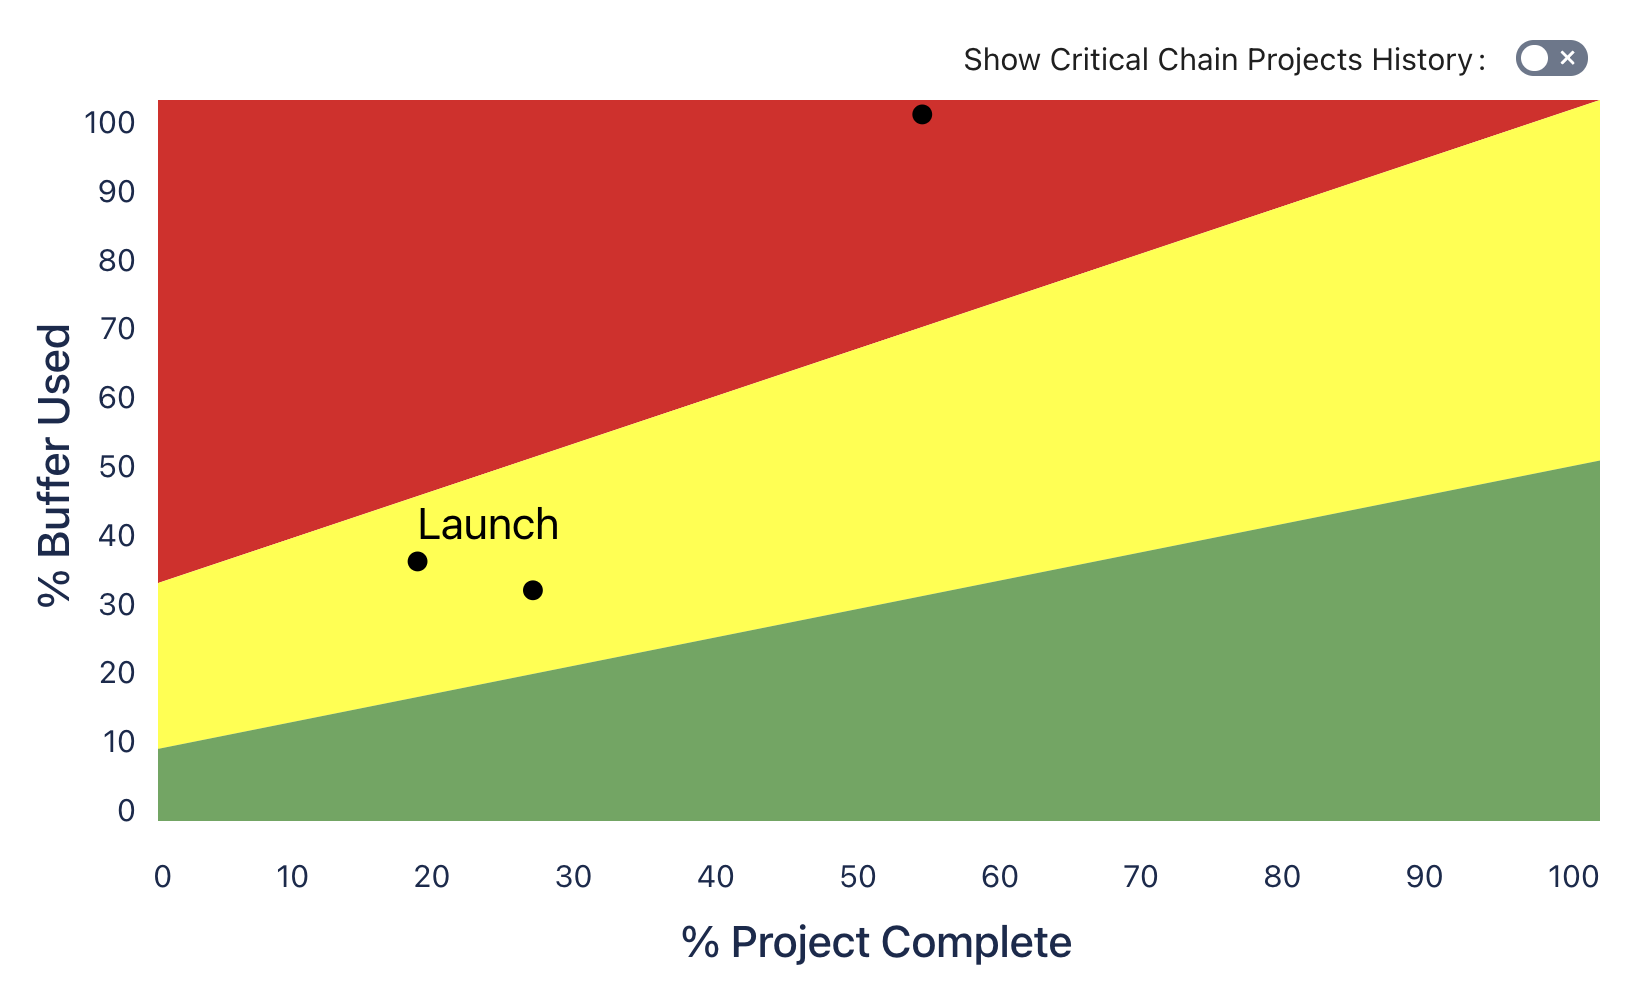
The Fever Chart provides a high-level visual summary of your project portfolio. It combines two key metrics:
- % Project Completion
- % Buffer Penetration
By default, the Fever Chart offers a Snapshot View, showing the current health of each project. Hover over any data point to see its project name:
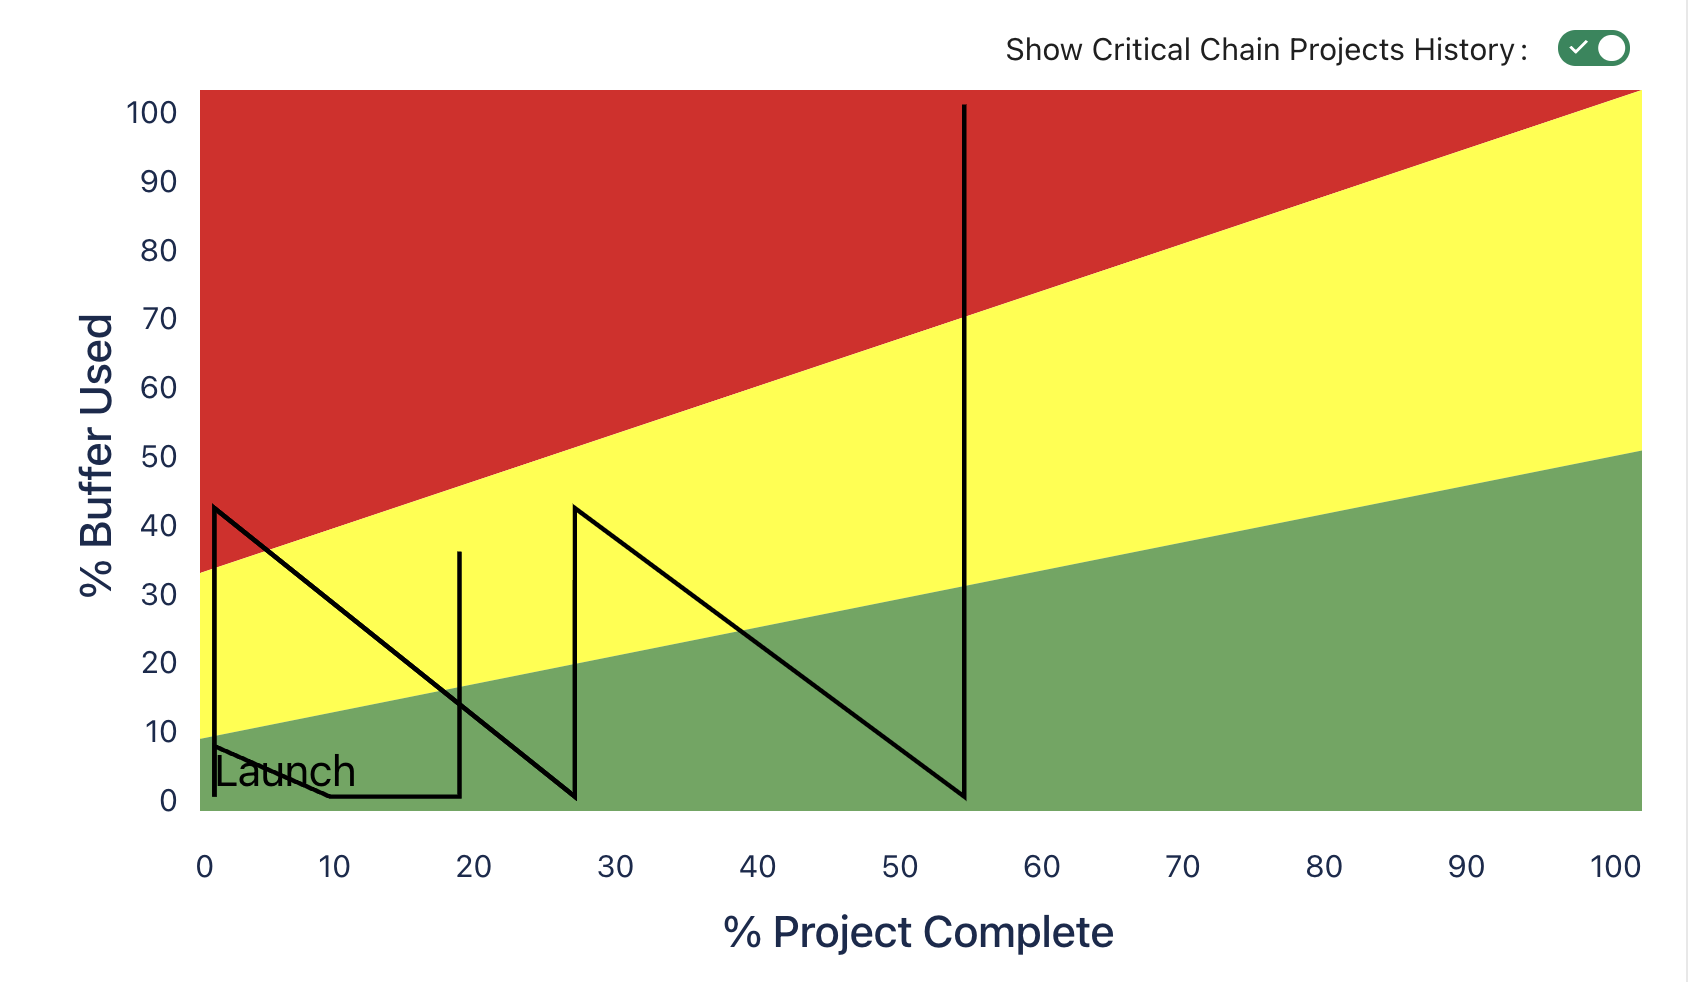
For deeper insights, you can use the toggle in the top-right corner to switch to the History View. This allows for a more in-depth analysis of project trends over time:
Fever Chart Zones
The Fever Chart categorizes buffer penetration into three distinct zones, helping you prioritize actions effectively:
- Green - Watch: Progress is on track; no immediate action is needed.
- Yellow - Plan: Start planning corrective actions to mitigate risks.
- Red - Act: Immediate intervention is required to keep the project on track.
With this visual tool, you can quickly identify which projects require your attention and take proactive steps to ensure portfolio success.
2. Learn from Finished Projects
Buffer penetration data from completed projects offers valuable insights for continuous improvement. Use these insights to refine your processes and buffer sizes.
-
Projects Frequently in the Red Zone
If the majority of your projects finish with high buffer penetration in the red zone or close to the end (top) of the yellow zone, this indicates that your buffers are too small. Consider increasing buffer sizes to better accommodate uncertainties and ensure project success. -
Projects Frequently in the Green Zone
If most of your projects finish with low buffer penetration in the green zone, this suggests your processes are mature and/or you add too much safety. You might consider reducing buffer sizes to deliver value faster without compromising reliability.
Retrospective Analysis for Continuous Improvement
Completed projects are a goldmine for learning. They allow you to perform a retrospective analysis to:
- Identify the key reasons for buffer penetration.
- Detect recurring issues or constraints.
- Pinpoint high-impact areas for improvement.
This process helps you uncover the most promising opportunities for optimization, driving continuous improvement across your organization.
By leveraging agileCCPM for Jira and Critical Chain methodologie, you can manage your projects more effectively, improve decision-making, and foster a culture of continuous improvement within your organization.
Learn about Global agileCCPM App and Project Settings